 Access
 Analyze
 Develop
 About
About
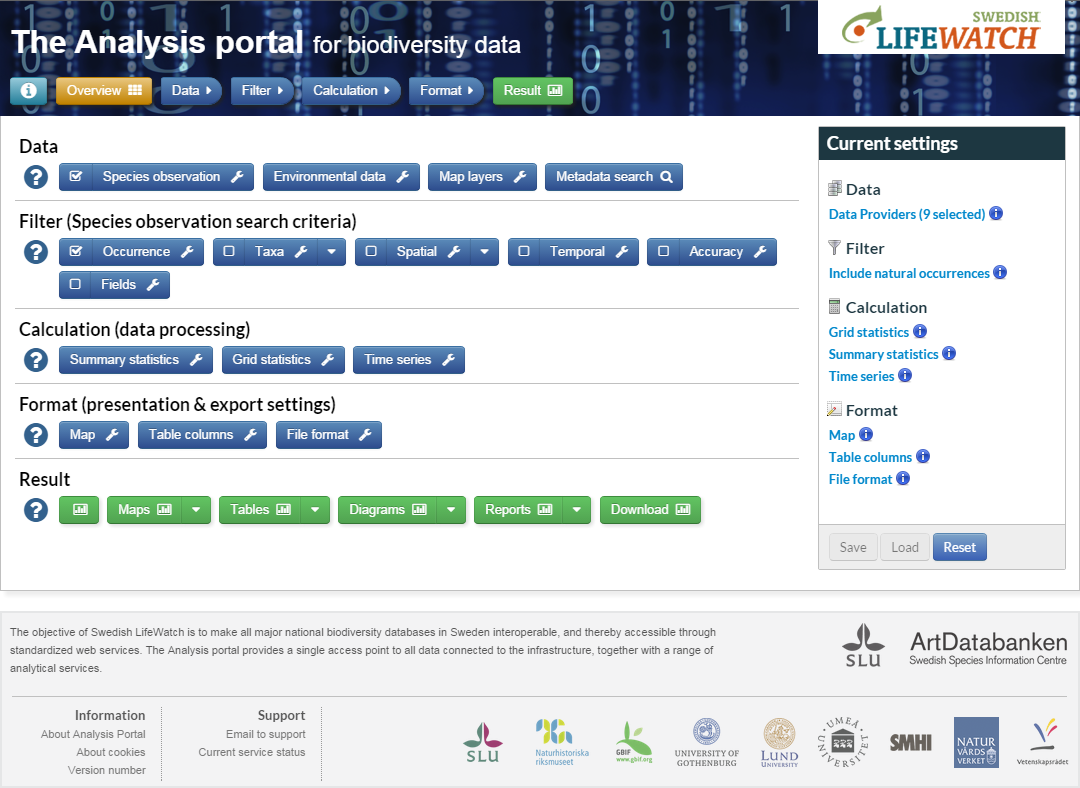
Analysis portal for biodiversity dataA web portal where Swedish species observations can be accessed, filtered, aggregated, and analyzed together with environmental or climate data. It supports data retrieval from all available data providers that are connected to the e-infrastructure. A number of analytical and visualization services are available, including species richness grid maps, observation maps, time series histograms, and ecological niche modeling. It is built for researchers, conservation biologists, and policy makers to allow better understanding and suitable management of biodiversity and ecosystem services. All services are provided by Swedish LifeWatch at no cost and all data is freely available with the exception for some data on certain threatened species. Log in is not required, but the user may register a personal account which enables some personalized settings. The Analysis portal uses the same user administration system as the Swedish Species Observation System (Artportalen). If you already have an account in Artportalen, you can use the same log in in the Analysis portal. |
|
The Swedish LifeWatch team at the Swedish Species Information Centre in Uppsala.
- Swedish Species Observations System (’Artportalen’) provided by Swedish Species Information Centre, SLU.
- Observation database of Red Listed Species provided by Swedish Species Information Centre, SLU.
- Swedish natural history collection data provided by DINA, GBIF and The Swedish Museum of Natural History.
- Species observations on fresh water invertebrates, algae, bacteria and plants provided by Environmental data MVM, SLU.
- The National Register of net-fishing (NORS) provided by Department of Aquatic Resources, SLU.
- The Database for electrofishing in streams (SERS) provided Department of Aquatic Resources, SLU.
- Wireless Remote Animal Monitoring Data provided by the Umeå Center for Wireless Remote Animal Monitoring (UC-WRAM), SLU
- Marine monitoring data (SHARK) provided by the Swedish Metrological and Hydrological Institute.
- The Swedish Taxonomic Database (Dyntaxa) provided by Swedish Species Information Centre, SLU.
All georeferenced environmental data published as either WFS or WMS can optionally be connected to the Analysis Portal.
- Selecting data provider: By default all available data providers connected to Swedish LifeWatch are selected for queries and statistical calculations. With this tool you can get information on each of the provider and select the ones to be included in your analysis.
- Add WFS Data layer: Many types of environmental data are provided as Web Feature Services (OGC WFS). With this tool such data can be added to the Analysis portal by just specifying its url. The tool supports filtering of the data in each layer based any feature attributes.
- Add WMS Map layer: The set of background map layers that can be used in the Analysis portal can be complemented using this tool. Any map layer provided with an OGC Web Map Service can be added by specifying its url.
- Search for data sets and map services: Swedish environmental data and map layers relevant for biodiversity related research can be searched for in a set of public metadata catalogues. This tool gives access to all of them.
- View summary statistics: This tool can be used to get a quick overview of the observation data that fits current search criteria in terms of number of records and number of observed species.
- View grid statistics on species richness: This tool calculates the number of species observed within each grid cell and visualize the result as a dynamic map which can be zoomed and clicked upon to get detailed information about single grid cells. The actual grid cell size and underlying geometric coordinate system can be specified.
- View grid statistics on number of observations: With this tool number of species observation records are visualized as a grid map. The actual grid cell size and underlying geometric coordinate system can be specified.
- View time series: This tools visualize the number of observations as a histogram.
- Plot observations: This tool plots species observations as points with circles representing the accuracy of the location coordinates.
- Filter observations: It is possible to filter the species observations from all the available data providers by specifying a set of search criteria.
- Set calculation properties: With this tool it is possible to specify actual grid size and other properties determining the way spatial statistics on species observations are calculated. It is also possible to adjust properties determining calculations of time series, such as length of time steps and periodicity.
- Set output formats: This tool can be used in order to adjust the format of various outputs in the Analysis Portal.
- Select visualization tool: This tool provides an overview of all types of visualizations of species observations and environmental data that can be used in the Analysis portal.
- Download: Species observations and environmental data can be downloaded from the Analysis portal in various forms. Use this tool to select which kind of download you want to use.
The Analysis portal is a web application which has been constructed based on the Microsoft .NET MVC Framework. All map functionality is constructed based on OpenLayers and the rest of the interactive visualizations is developed using HTML5, jQuery, Knockout js and Bootstrap. The application is just a tool that enables end users to combine the functionality of a set of web services with each other in a way relevant for many scientists using biodiversity data.