 Access
 Analyze
 Develop
 About
About
RShiny LifeWatch Data ExplorerThis interactive online tool gives access to all sensor data collected in the framework of the Flemish LifeWatch project, and provides an interface to explore and analyze these data. Some of the more recent data is temporarily under moratorium and therefore protected by password access. Several thematic portals have been set up as part of the Data Explorer: |
|
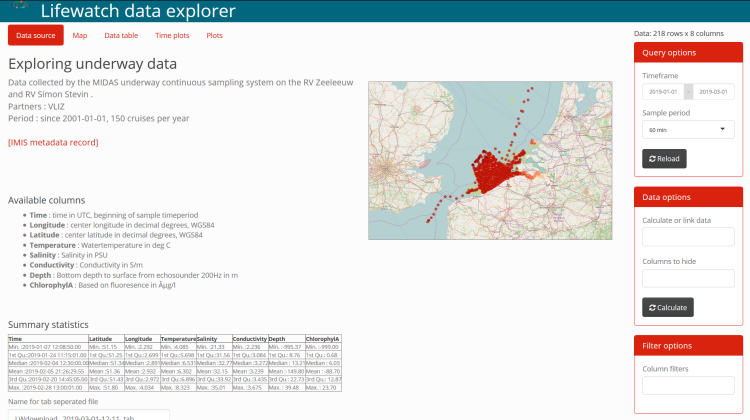
Within the RShiny LifeWatch Data Explorer, 5 general sections are available to explore, plot, visualize and download data. A detailed overview of all functionalities can be found in the online manual.
The Rshiny LifeWatch Data Explorer has been developed by the Flanders Marine Institute (VLIZ) in 2015-2016.
This interactive online tool gives access to all sensor data collected in the framework of the Flemish LifeWatch project.
The LifeWatch Data Explorer is built using RShiny server, Leaflet, ggplot2, PLotly, Dygraph and DataTables. The system is able to query MSSQL, PostgreSQL, Geoserver (WFS) and MongoDB servers.